Introduction
A production IIS server has been reported hang once a day. We tried every possible ways to find and remedy the situation with no luck. Fortunately, from memory dump, we found some clues that eventually pinpoint the source of problem. In here, I will put all the information and experience I got from the process of capturing and analyzing memory dump.The environment
This is an ASP.NET 2.0 based web application that is running in Windows 2008 server and use SQL Server 2008 as database. The web application is dealing with documents heavily. All documents are stored in a dedicated document server. All the servers are VMWare based virtual server.The problem
In last several months, our client start to experience server hang occasionally. When the server hangs, nobody can use the web application and system administrator can’t even remote into the server. In the beginning, we checked server configuration, software installed, processes are running, application source code, event viewer, IIS log, etc to try find some clue. Unfortunately, there is nothing unusual. So, we start to focus on finding a way to gather more information when IIS hang happening. The idea is to capture IIS memory dump during server hang and use memory dump tool to understand what’s happening at that moment.Tools
In order to get memory dump during server hang happening, we need following tools.Windows Debugging Tool
Windows debugging tool can be obtained from Microsoft’s Download and Install Debugging for Windows page (http://msdn.microsoft.com/en-us/windows/hardware/gg463009). The Windows Software Development Kit (SDK) for Windows 8 Consumer Preview is the one contains latest windows debugging tool.After installed Windows Software Development Kit for Windows 8 Consumer Preview, you will have a Windows Kits folder in C:\Program Files (or C:\Program Files (x86) in 64 bit Windows). Don’t gets confused this with Windows SDK folder that could already exists in your C:\Program Files (or C:\Program Files (x86) in 64 bit Windows). There are many tools in Windows Kits. What we gonna to use are:
(1) cdb.exe
A user-mode debugger with a console interface. This will be used later in memory dump capturing script.
(2) windbg.exe
A user-mode and kernel-mode debugger with a graphical interface. This will be used to analyze captured memory dump.
Debug Diagnostic Tool v1.2
The Debug Diagnostic Tool (DebugDiag) is designed to assist in troubleshooting issues such as hangs, slow performance, memory leaks or memory fragmentation, and crashes in any user-mode process. This tool includes additional debugging scripts focused on Internet Information Services (IIS) applications, web data access components, COM+ and COM+ related Microsoft technologies, SharePoint, and .NET framework. What we really needed from Debug Diagnostic Tool is those debugging extensions for windbg.How to setup sever hang memory dump capturing
Our client’s server is Windows Server 2008 that has IIS 7 come with it. Follow below steps can setup a trigger for generating memory dump when IIS hang.1. Create a GenerateDump.bat batch file
The batch file contains following script@if "%_echo%"=="" echo off setlocal set TIMESTAMP=%DATE:~-9%_%TIME% set TIMESTAMP=%TIMESTAMP:/=_% set TIMESTAMP=%TIMESTAMP::=_% set TIMESTAMP=%TIMESTAMP:.=_% set TIMESTAMP=%TIMESTAMP: =_% set FILENAME=c:\crash_PID_%1_%TIMESTAMP%.dmp set LOG=c:\log.txt set COMMAND= C:\Program Files (x86)\Windows Kits\8.0\Debuggers\x64\cdb.exe -c ".dump /o /ma %FILENAME%;q" -p %1 echo %COMMAND% > %LOG% %COMMAND% endlocal
2. Configure the Orphan Worker Process Settings
(1) In command window, go to adminscripts folder of inetpubcd c:\inetpub\adminscripts(2) To enable the orphan worker process feature, type the following command at the command prompt
adutil.vbs SET W3SVC/AppPools/DefaultAppPool/OrphanWorkerProcess TRUE(3) At the command prompt, set the batch script in step 1 to run when a process is scheduled to be recycled.
adsutil.vbs SET W3SVC/AppPools/DefaultAppPool/OrphanActionExe “c:\GenerateDump.bat”

adsutil.vbs SET W3SVC/AppPools/DefaultAppPool/OrphanActionParams “%1%”
Note: Make sure that the OrphanActionExe option points to the location of the batch file that was created above and make sure the account of w3wp.exe process has Read and Execute permissions to that file.
How to analyze memory dump
After a dump file is captured during IIS hang, we use windbg to open up the dump fileLoad memory dump into windbg
(1) Open up windbg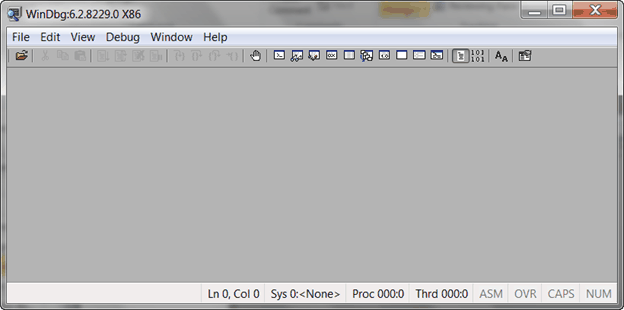
There are x86 version windbg and x64 version windbg. Which one to run not depends on your development machine’s Windows version, it depends on your memory dump machine’s Windows version. Based on the version of windbg you run, you need to load corresponding debugging extensions in following steps.
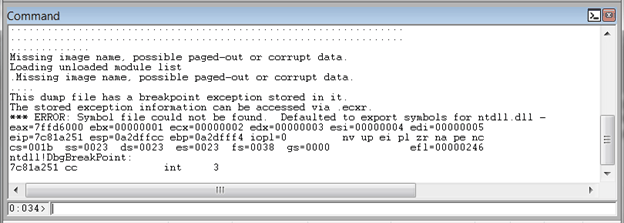
(2) Go to File -> Open Crash Dump. Choose the dump file captured by your IIS server.
(2) Run command
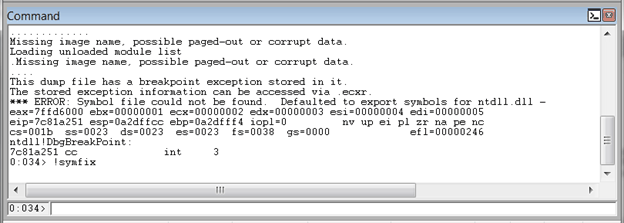
!symfix
This command will automatically set the symbol path to Microsoft’s symbol store. By doing this, you must have Internet connection available. Alternatively, you can download symbols to your local in advance or just directly point to Microsoft’s symbol server with syntax like this
srv*c:\symbols*http://msdl.microsoft.com/download/symbols
Load additional debugging extensions
The built-in command of windbg provides limited analysis functionality for managed memory dump, so you need some debugging extensions to help reveal more information inside managed memory dump(1) Run command
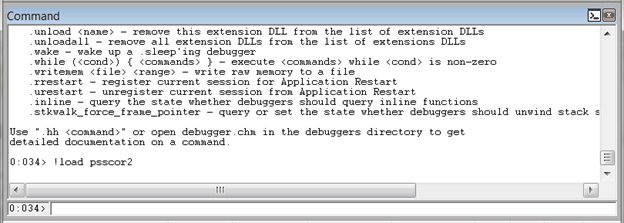
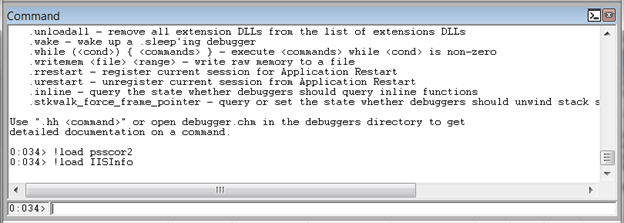
!load psscor2Psscor2 is a part of Debug Diagnostic Tool. It is a managed debugging extension of windbg. It’s designed to debug ASP.NET 2.0 and 3.5 memory dump. You can also load Psscor4 into windbg if want to debug ASP.NET 4.0 application memory dump. Psscor2 is a superset of debugging extension sos. By loading this debugging extension into windbg, we don’t need sos debugging extension anymore.
If you load psscor2 failed because can’t find correct version mscordacwks, then you can use
.cordll –ve –u –I mscorwks –lto load the correct one. The cordll command will try to find the correct mscorwks from several different locations and tells you whether those attempting success or not.
(2) Run command
!load IISInfoIISInfo debugging extension is also a part of Debug Diagnostic Tool. It’s used to show IIS and ASP information in memory dump
Analyze memory dump with debugging commands
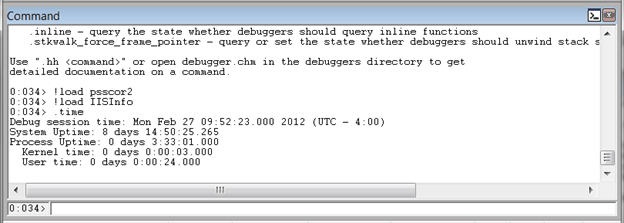
(1) Run command.timeThis is a windbg built-in command. It’s used to display system up time, process up time, kernel time, and user time.
(2) Run command
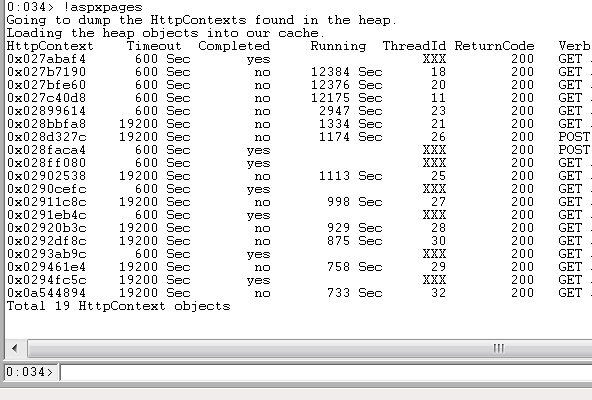
!aspxpagesThis is a command from psscor2 debugging extension. It is used to list which ASP.NET pages are being processed in which threads.
(3) Run command
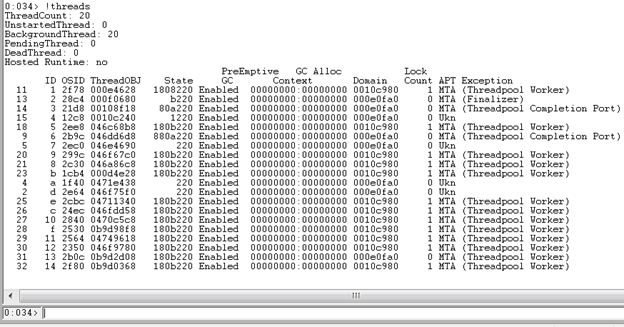
!ThreadsIt is a command from psscor2 debugging extension. It is used to list all running threads in memory dump
(4) run command
~[Thread Id]sIt is a command from psscor2 debugging extension. It is used to select specific thread

(5) run command
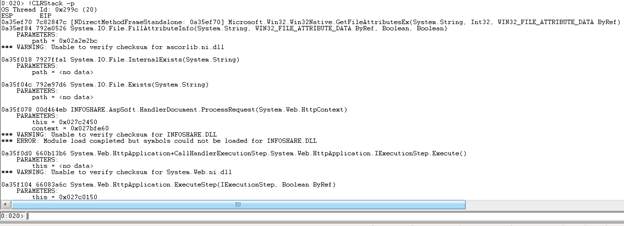
!CLRStack –pIt’s a command from psscor2 debugging extension. It is used to show the current selected thread’s CLR stack trace with parameter information
(6) Run command
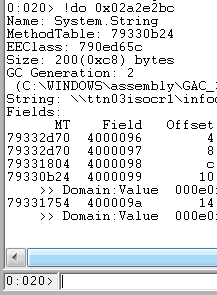
!do [memory address]It’s a command from psscor2 debugging extension. It is used to reveal content in specified memory address.
(7) Run command
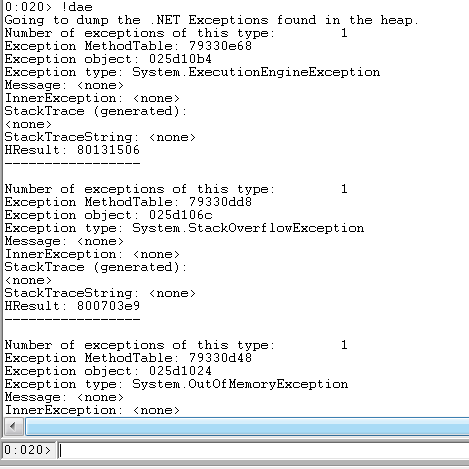
!daeThis is a command from psscor2 debugging extension. It is used to dump all .NET exceptions found in your memory dump.
(8) Run command
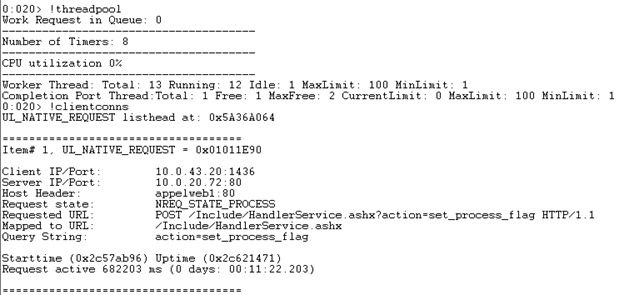
!threadpoolIt’s a command from psscor2 debugging extension. It is used to find out exactly what the CPU usage was at the time the dump was taken. We’ll also get some useful information like the number of work requests in the queue, completion port threads and timers.

(9) Run command
!clientconnsIt’s a command from IISInfo debugging extension. It’s used to see all client connections.
With introduction as well with coding Troubleshoot ASP.NET application hang with memory dump. It is very nice for users when they get in problem..
ReplyDeleteHire Expert ASP.Net Developer India