Tuesday, January 24, 2017

Performance Problem Troubleshooting Guideline


Introduction

This guideline is to define general steps we need to follow when deal with performance problem.

Performance Problem

What is performance Problem? We will deem there is a performance problem when we found any of following symptoms
1.      CPU usage is over 90% for more than 120 seconds.
2.      CPU usage is over 90% on average.
3.      Memory usage is over 80% for more than 120 seconds.
4.      Memory usage is over 80% on average.
5.      Open a normal webpage takes more than 15 seconds.
6.      Open a complicate webpage takes more than 60 seconds.
7.      Got “Internet Explorer cannot display the page” error when try to open a page.
8.      Got “Timeout expired” error when try to open a page.
9.      Application is very lagging in general.

Performance Problem Confirmation

Before we start troubleshooting, we need to confirm it is a real performance problem instead of false positive by trying any of followings
1.      Try to reproduce the performance problem by browsing to the page that is reported can’t be opened or take a long time to open. Write down the steps.
2.      Check CPU usage. Write down the percentage of CPU usage and the length of time it last.
3.      Check memory usage. Write down the percentage of memory usage and the length time it last.

Troubleshooting Guideline

General Information Collecting

In order to troubleshoot a performance problem, we need to know

Client Computer
1.      Operation system type and version (Windows version)
2.      CPU type, frequency, and number of cores
3.      Memory size
4.      Disk space
5.      Browser type and version

Application Server
1.      Operation system type and version (Windows version)
2.      CPU type, frequency, and number of cores
3.      Memory size
4.      Disk space
5.      Number of web applications installed

Database Server
1.      Operation system type and version (Windows version)
2.      CPU type, frequency, and number of cores
3.      Memory size
4.      Disk space
5.      Number of databases

We also need to ask
1.      Can we reproduce this problem?
2.      When is this problem started?
3.      Is this problem happened constantly or once a while?
4.      Is this problem happened to certain people or to everybody?
5.      Is this problem happened after a specified operation or action?
6.      Is there is major change recently?

Troubleshooting

If problem is reproducible, then we need to reproduce the problem and
1.      Run SQL Server Profiler to capture database activates. And then analyze trace file.
2.      Check which process has highest CPU usage and/or memory usage.
3.      If w3wp process has the highest CPU usage and/or memory usage, then run memory dump tool to dump w3wp process when CPU reach 90% or memory is over 80%. And then analyze dump file.

If problem is not reproducible, then
1.      Run SQL Server Profiler for a whole day to capture a whole day activities. And then analyze trace file.
2.      Setup memory dump tool to automatically capture full memory dump when CPU reach 90% or memory is over 80%. And then analyze dump file.


If we come across the moment of CPU reaches 90% and memory is over 80%, then we should immediately
1.      Run SQL Server Profiler to capture the current activities. Andy then analyze trace file.
Check which process used the most CPU and/or memory, and capture a memory dump immediately to that process. And then analyze dump file.

SQL Server “Hidden” Features


1.     Introduction

Microsoft works so hard to release new versions of SQL Server with all the improvements and new features every 2 years. In this article, I want to review 5 features that haven’t been utilized by us. I don’t want to call them new features because some of them exist for a long time, we just don’t realize they are there or we just don’t know how to use them.

2.     Features

2.1     Feature #1: Table-Valued Parameter

When is it introduced?
Table-Valued Parameter is introduced in SQL Server 2008

What is Table-Valued Parameter?
Table-valued parameters are declared by using user defined table types. You can use table-valued parameters to send multiple rows of data to a Transact-SQL statement or a routine, such as a stored procedure or function, without creating a temporary table or many parameters.

Table-valued parameters are like parameter arrays in OLE DB and ODBC, but offer more flexibility and closer integration with Transact-SQL. Table-valued parameters also have the benefit of being able to participate in set based operations.

Where to use it?
One place to use it is to pass unlimited parameters to a stored procedure. For example, we have such stored procedure usp_process_all. It is designed to let user can delete selected documents. There is a @document_ids parameter that is in varchar(max) type. A better design is to store all selected document_id in a table value parameter and pass it into the stored procedure.

CREATE PROCEDURE usp_process_all
            @document_ids varchar(max),
AS
BEGIN
    ...
END


2.2     Feature #2: CLR in SQL Server

When is it introduced?
CLR in SQL Server is introduced in SQL Server 2008

What is CLR in SQL Server?

The common language runtime (CLR) is the heart of the Microsoft .NET Framework and provides the execution environment for all .NET Framework code. Code that runs within the CLR is referred to as managed code. The CLR provides various functions and services required for program execution, including just-in-time (JIT) compilation, allocating and managing memory, enforcing type safety, exception handling, thread management, and security.

With the CLR hosted in Microsoft SQL Server (called CLR integration), you can author stored procedures, triggers, user-defined functions, user-defined types, and user-defined aggregates in managed code. Because managed code compiles to native code prior to execution, you can achieve significant performance increases in some scenarios.

You can create stored procedure, trigger, user-defined function in SQL Server. But, SQL has very limited ability to handle complicate situations, such as check if date is in a string. The solution is to create a stored procedure, trigger, or function with C#.NET

Where to use CLR in SQL?
To search something in memo field
SELECT TOP 1000 memo
FROM [product]
WHERE memo MATCH('$abc.*')


2.3     Feature #3: Improved Date and Time Types

When are they introduced?
Date, Time, DateTime2, and DateTimeOffset are introduced in SQL Server 2008

What are improved Date and Time types?
There are Date, Time, DateTime2 and DateTimeOffSet added in SQL Server 2008. time, datetime2 and datetimeoffset provide more seconds precision. Datetimeoffset provides time zone support for globally deployed applications.

Date
Defines a date in SQL Server

Time
Defines a time of a day. The time is without time zone awareness and is based on a 24-hour clock.

DateTime2
Defines a date that is combined with a time of day that is based on 24-hour clock. datetime2 can be considered as an extension of the existing datetime type that has a larger date range, a larger default fractional precision, and optional user-specified precision.

DateTimeOffset
SQL Server added a new data type named “datetimeoffset”. This is similar to the old datetime data type, with the following significant differences:
-          Internally, the time is stored in unambiguous UTC format
-          The local time zone offset is stored along with the UTC time, which allows the time to be displayed as a local time value (or converted to any other time zone offset)
-          The data type is capable of storing more precise times than datetime

Where to use improved Date and Time Types?
Sometimes, we need to store datetime in UTC format. And then, we can use DateTimeOffset.

2.4     Feature #4: Table Partition

When is it introduced?
Table Partition is introduced in SQL Server 2005 Enterprise Edition

What is table partition?
In order to answer this question, we need to answer following questions.

What are partitions and why use them? The simple answer is: To improve the scalability and manageability of large tables and tables that have varying access patterns. Typically, you create tables to store information about an entity, such as customers or sales, and each table has attributes that describe only that entity. While a single table for each entity is the easiest to design and understand, these tables are not necessarily optimized for performance, scalability, and manageability, particularly as the table grows larger.

What constitutes a large table? While the size of a very large database (VLDB) is measured in hundreds of gigabytes, or even terabytes, the term does not necessarily indicate the size of individual tables within the database. A large database is one that does not perform as desired or one in which the operational or maintenance costs have gone beyond predefined maintenance or budgetary requirements. These requirements also apply to tables; a table can be considered large if the activities of other users or maintenance operations have a limiting affect on availability. For example, the sales table is considered large if performance is severely degraded or if the table is inaccessible during maintenance for two hours each day, each week, or even each month. In some cases, periodic downtime is acceptable, yet it can often be avoided or minimized by better design and partitioning implementations. While the term VLDB applies only to a database, for partitioning, it is more important to look at table size.

In addition to size, a table with varying access patterns might be a concern for performance and availability when different sets of rows within the table have different usage patterns. Although usage patterns may not always vary (and this is not a requirement for partitioning), when usage patterns do vary, partitioning can result in additional gains in management, performance, and availability. Again, to use the example of a sales table, the current month's data might be read-write, while the previous month's data (and often the larger part of the table) is read-only. In a case like this, where data usage varies, or in cases where the maintenance overhead is overwhelming as data moves in and out of the table, the table's ability to respond to user requests might be impacted. This, in turn, limits both the availability and the scalability of the server.

Additionally, when large sets of data are being used in different ways, frequent maintenance operations are performed on static data. This can have costly effects, such as performance problems, blocking problems, backups (space, time, and operational costs) as well as a negative impact on the overall scalability of the server.

How can partitioning help? When tables and indexes become very large, partitioning can help by partitioning the data into smaller, more manageable sections. The table partition feature focuses on horizontal partitioning, in which large groups of rows will be stored in multiple separate partitions. The definition of the partitioned set is customized, defined, and managed by your needs. Microsoft SQL Server 2005 allows you to partition your tables based on specific data usage patterns using defined ranges or lists. SQL Server 2005 also offers numerous options for the long-term management of partitioned tables and indexes by the addition of features designed around the new table and index structure.

Furthermore, if a large table exists on a system with multiple CPUs, partitioning the table can lead to better performance through parallel operations. The performance of large-scale operations across extremely large data sets (for instance many million rows) can benefit by performing multiple operations against individual subsets in parallel. An example of performance gains over partitions can be seen in previous releases with aggregations. For example, instead of aggregating a single large table, SQL Server can work on partitions independently, and then aggregate the aggregates. In SQL Server 2005, queries joining large datasets can benefit directly from partitioning; SQL Server 2000 supported parallel join operations on subsets, yet needed to create the subsets on the fly. In SQL Server 2005, related tables (such as Order and OrderDetails tables) that are partitioned to the same partitioning key and the same partitioning function are said to be aligned. When the optimizer detects that two partitioned and aligned tables are joined, SQL Server 2005 can join the data that resides on the same partitions first and then combine the results. This allows SQL Server 2005 to more effectively use multiple-CPU computers.

History of partition
Partitioning Objects in Releases before SQL Server 7.0 (This is designed by application designer. We are still doing this today)
Partitioned View in SQL Server 7.0 (Only allow SELECT)
Partitioned View in SQL Server 7.0 (Also allow INSERT, UPDATE, DELETE)
Partition Table in SQL Server 2005

Where to use Table Partition?
Application may stores a lot of data. For example, one of our application has a table that contains more 1 million records. The application performance becomes unbearable when user tries to review data in those big tables. We did a lot of table optimization and designed archive data to store old data. If we use table partition, then we don’t need to create archive database and manually move old data into it anymore.

2.5     Feature #5: Pagination

When is it introduced?
Table Partition is introduced in SQL Server 2005 Enterprise Edition

What is pagination?
Pagination is a common use case throughout client and web applications everywhere. Google shows you 10 results at a time, your online bank may show 20 bills per page, and bug tracking and source control software might display 50 items on the screen.

Based on the indexing of the table, the columns needed, and the sort method chosen, paging can be relatively painless. If you're looking for the "first" 20 customers and the clustered index supports that sorting (say, a clustered index on an IDENTITY column or DateCreated column), then the query is going to be pretty efficient. If you need to support sorting that requires non-clustered indexes, and especially if you have columns needed for output that aren't covered by the index (never mind if there is no supporting index), the queries can get more expensive. And even the same query (with a different @PageNumber parameter) can get much more expensive as the @PageNumber gets higher – since more reads may be required to get to that "slice" of the data.

Some will say that progressing toward the end of the set is something that you can solve by throwing more memory at the problem (so you eliminate any physical I/O) and/or using application-level caching (so you're not going to the database at all). Let's assume for the purposes of this post that more memory isn't always possible, since not every customer can add RAM to a server that's out of memory slots, or just snap their fingers and have newer, bigger servers ready to go. Especially since some customers are on Standard Edition, so are capped at 64GB (SQL Server 2012) or 128GB (SQL Server 2014), or are using even more limited editions such as Express (1GB) or whatever they're calling Azure SQL Database this week (many different servicing tiers).

SQL Server 2012 added OFFSET / FETCH that provides more linear paging performance across the entire set, instead of only being optimal at the beginning.

Where to use pagination?
We have a long history of trying to tackle the pagination challenge in a web application.

In the beginning, there is ASP.NET default pagination. We retrieve all the data from database and load them into DataGrid. If the search result has 100K records, even we just want to show the first page, we will transfer the 100K records from database server to application, load them into DataGrid, then transfer the 100K records from application to client browner. This generates a lot of network traffic and makes application very slow.

Then, we start to use custom paging in DataGrid, so we will only load the first data into DataGrid and tell DataGrid what’s the total number of records. In order to do so, we created two routings to get current page and total number. Because there is not always a record number to let us get the current page, so we need to load data into a temp table in SQL Server, and then based on the auto-generated record number to get the current page.

SQL Server 2005 introduced Window function, it can be used to avoid using temp table get record number, so we are able to get the current page much quicker. However, window page is not optimized for pagination, so there is still performance impact.

3.     References

(1)   Table Value Parameters in SQL Server 2008 and .NET (C#) (https://www.mssqltips.com/sqlservertip/2112/table-value-parameters-in-sql-server-2008-and-net-c/)
(3)   Choosing Between DateTime, DateTimeOffset, TimeSpan, and TimeZoneInfo (https://msdn.microsoft.com/en-us/library/bb384267%28v=vs.110%29.aspx)
(4)   Partitioned Tables and Indexes in SQL Server 2005 (https://technet.microsoft.com/en-us/library/ms345146%28v=sql.90%29.aspx#sql2k5parti_topic1)


Sunday, January 27, 2013

Troubleshooting ASP.NET based Enterprise Application Performance Problem

Download PerformanceDemo source code
Download Database script

Introduction

How to find and resolve performance problem of ASP.NET based enterprise application has been discussed so many times. In here, I want to talk about this topic from a different perspective.

Possible Causes of Performance Problem

Performance problem could have many different reasons, such as inferior hardware, poorly designed software, slow network connection, lacking of table index, etc. In here, I will only focus on Database and Application that have most dynamic factors and can be improved or adjusted by software developers.

Database

An enterprise application usually uses relational database as backend to store business data. Due to most enterprise applications don’t deal with massive data and don’t serve client in very complicated environment, so we don’t need to talk about advanced performance topics here, such as data distribution, data partition, high concurrency, etc. A performance problem comes from database can be usually associated with Table design, Index, and Query.

Table design

In most situations, table should be designed to reach 3rd or 4rd normalization form. However, a higher normalization could result in complicated table join in query, so you need to trade off a little bit normalization to gain performance in certain area. Another thing on table design is the field type, such as you should use smallint instead of int when int is not necessary. By giving proper field type, you will have better data type check and smaller data footprint. One more thing about table design is the primary key and foreign key. With appropriate primary key and foreign key assigned will not only guarantees data relationship and data integrity, but also helps query engine to choose the right execution plan.

Index

Index is defined on table, but because it’s very crucial to database performance, so I want to talk about it separately from table design. There are many types of index. Two most frequently used types of index are cluster index and non-cluster index. Cluster index will force database to store data according to the cluster index field(s). If there is no cluster index defined, table data will be stored in heap structure. To retrieve a particular record, a table scan will be conducted. After a cluster index defined (one and only one cluster index can be defined on a table), data are stored in B-tree structure. Data retrieving operation becomes much efficient by using binary search algorithm. Usually, the cluster index is defined on primary key because primary key field is unique and most likely is in integer type. It’s more efficient to be used to organize data in B-tree. Only have cluster index is not enough, we need to add many non-cluster indexes to handle variant situations. The suitable indexes can be added manually from experience or be generated automatically from query optimizer, such as SQL Server Query Optimizer. Have proper indexes defined is not done yet, because database query engine looks at statistics to decide which index should be used if there are more than one index available. So, keep database statistics up-to-date is also very important.

Query

After you have decent table design and proper index specified. The next key factor relates to database performance is query itself. SQL (Structure Query Language) is the standard language used in every database platform. However, a proper written SQL could result in big performance difference compare with improper written SQL. Basic SQL syntax is always the primary choice instead of advanced SQL syntax, e.g. sub query is preferred over user defined function for selecting data. Whether use inner join, outer join, or fields and their sequence in where clauses are all have impact on the performance.

Application

How good the design of an application is also determines how good the system performance is. Especially for algorithms deal with data directly, if application processes data in most efficient way, then the system performance will be better. Vice versa, if the application doesn’t process data so efficiently, then the system will be lagging.

Performance Troubleshooting

How to determine there is a performance problem

For a web application, you can have very scientific approach to gather application performance metrics with tools to show the application is having performance problem, or by rule of thumb, when a web page takes more than 5 seconds to load, then there is a potential performance problem.

Profiling a web page loading time

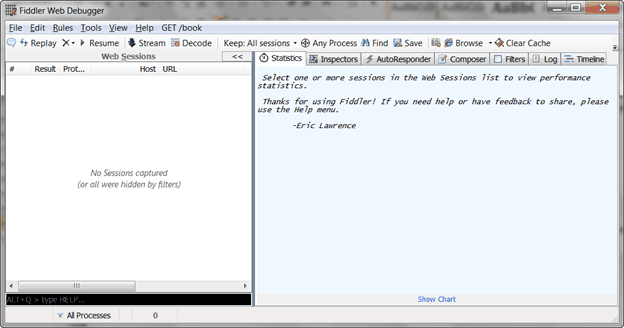
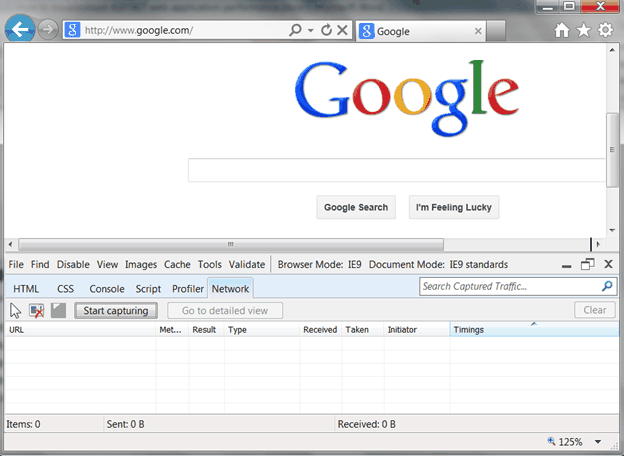
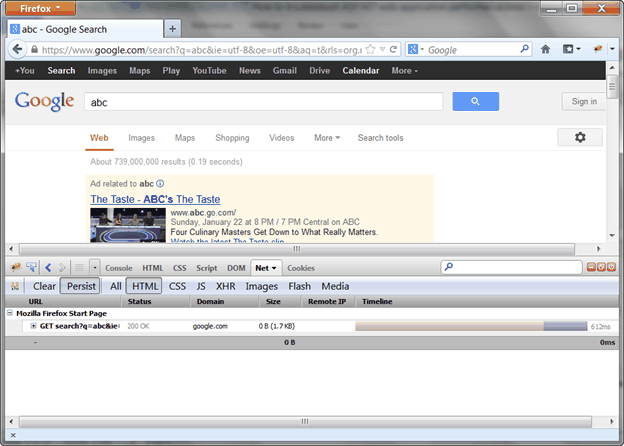
There are many tools that can be used to measure how long a web page is loaded. Fiddler, Internet Explorer Developer Toolbar, and Firebug are three commonly used tools.

Fiddler

Fiddler is a Web Debugging Proxy which logs all HTTP(S) traffic between client and web server. It is free and can be downloaded from www.fiddler2.com.
Internet Explorer Developer Toolbar

The original Internet Explorer Developer Toolbar is a separate installation that must be downloaded and installed individually. After Internet Explorer 8.0, it becomes a part of default components. Initially Internet Explorer Developer Toolbar doesn’t support network traffic profiling and it is added in later version.
Firebug

Firebug is a web development tool that facilitates the debugging, editing, and monitoring of website’s CSS, HTML, DOM, XHR, and JavaScript. It is an optional add-on of Firefox browser. It needs to be installed explicitly.
How to find the cause of performance problem

After a web performance problem is determined, the next step is to pinpoint where the performance is from.

Profiling Database Activities

The practice I use is to profile database performance first to determine whether the performance problem comes from database. For SQL Server database, we can use SQL Server Profiler to capture all database activities to a particular database and to see which activity looks suspicious. SQL Server Profiler is a part of SQL Server Database Tool.
Analyzing SQL statement

If there is a suspicious activity found that runs for too long, then we can copy the query of that activity out and put it into SQL Server Management Studio to do further analysis.
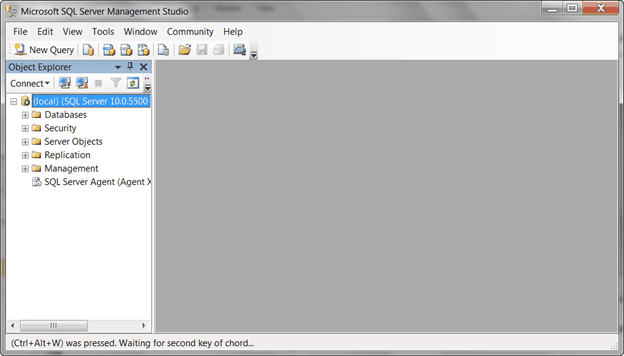
The best way to show how the query gets executed is by looking at the Actual Execution Plan of that query when it is running in SQL Server Management Studio.

If no suspicious long running activity found in SQL Server Profiler, then, the performance problem is most likely from application.

Capturing Memory Dump

To determine which part of the application runs for that long, we can usually use memory dump tool, DebugDiag, to capture several memory dumps at the moment we feel application was stuck.

Analyzing Memory Dump

After done with memory dumping, the dumped memory files can be loaded back into DebugDiag and be used to generate memory dump report. From the memory dump report, we can easily see which function was be executed, therefore, we can go back to the source code to find that function and analyze why it runs for that long, or have unit test for that piece of code with similar environment provided to see whether we can reproduce the long running situation in development environment.

Found No Problem in both Database and Application

If there is no problem found in both database and application, unfortunately, the cause of performance problem is out of software developer’s knowledge domain, therefore we need to ask help from system administrator or network engineer for further troubleshooting.

Experiment

Let’s have two experiments to see how we troubleshoot performance problem in action. One performance problem is from database and another performance problem is from application.

Demo Application

The demo application is created with ASP.NET MVC 4. It has two demo pages: Slow Page and Slow Database Page. The Slow Page has performance problem on application side and Slow Database Page has performance problem on database side.
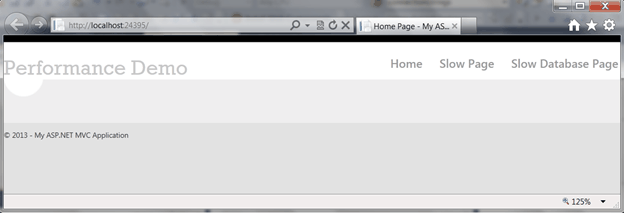

Note: the demo application contains impractical code logic and SQL statement that are only for demonstration purpose.

Troubleshooting Database Performance Problem

The Slow Database Page has performance problem. This can be verified with Fiddler.
1. Run Fiddler.
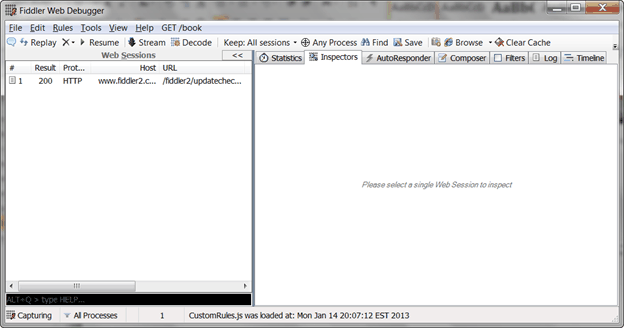
The Fiddler default starts in running state. It will try to capture all HTTP(S) traffics.
2. Click on Slow Database Page link to open it up.
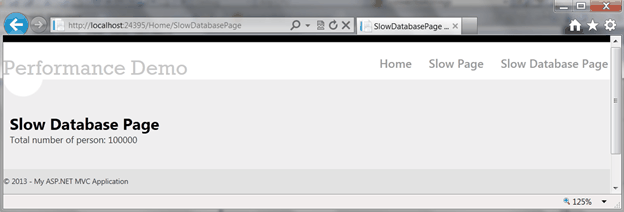
3. You should see an item that has URL to /Home/SlowDatabasePage in Fiddler Web Session panel. (Note: you can stop fiddler capturing to prevent from capturing other HTTP(S) activities)

4. By selecting the captured web session item, you can see the total time took to render this page (It is highlight in red box).

This page took more than 15 seconds to load. From this, we can conclude there is a performance issue in Slow Database Page.
After we determined there is a performance problem, the next step is to use SQL Server profiler to profile database activities.
1. Open up SQL Server Profiler.
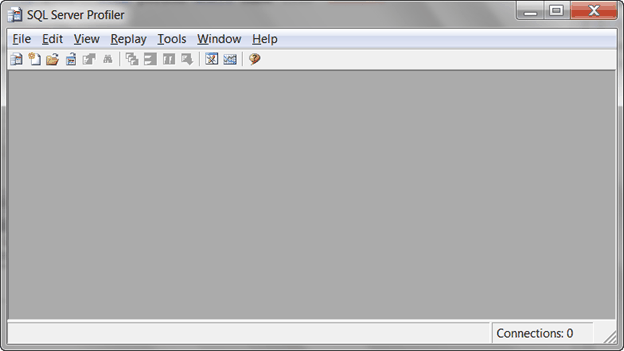
2. Start a new trace to monitor any database activity happens on PerformanceDemo database. (Note: PerformanceDemo database is the database that our demo application is using at backend.)

3. Reload the Slow Database Page.
4. There are some database activities captured in SQL Server Profiler.
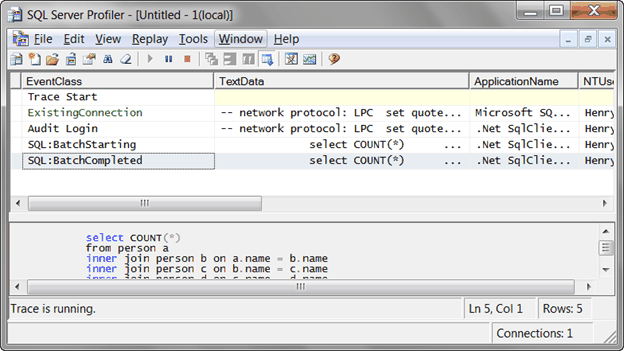
Stop the profiler to prevent from any further database activities be captured.
5. Look through each record in profiler and find the one that has the biggest number of Duration.

There is a query takes 10906 milliseconds, 10.906 seconds, to finish. This tells us that Query has performance problem.
6. By highlighting the record, you can see the full SQL statement in the bottom panel. Select and copy the SQL statement from SQL Server Profiler into SQL Server Management Studio for further analyzing. (Note: the SQL is ridiculously miswritten for demonstration purpose)
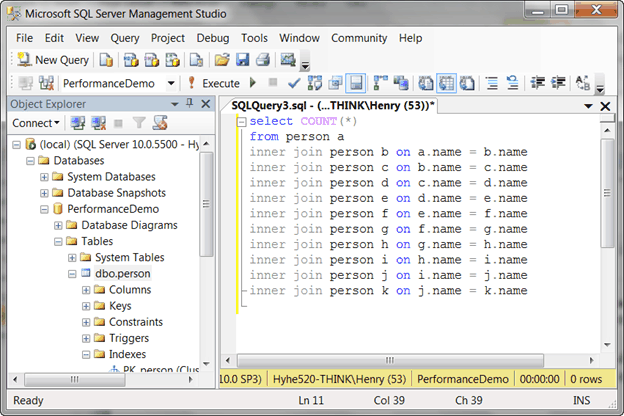
7. Turn on Actual Execution Plan by going to Query -> Include Actual Execution Plan and execute the SQL again.

An Execution Plan tab is shown up in the bottom panel. After selected the Execution plan tab, you can see how SQL Server Query Engine executes this query.

If you study on the execution plan, you can see the query is doing table scan and other inefficient operation.

According to what we found in execution plan, we can optimize the query by adding cluster index on Person table to avoid table scan.

Troubleshoot Application Performance Problem

After walked through the steps of troubleshooting database performance problem, let’s take a look how to troubleshoot application performance problem. We can still use above demo application. The Slow Page also has performance problem, this can be confirmed by Fiddler.
1. Run Fiddler.

2. Click on Slow Page link to open it up.

3. You should see an item that has URL to /Home/SlowPage in Fiddler Web Session panel.
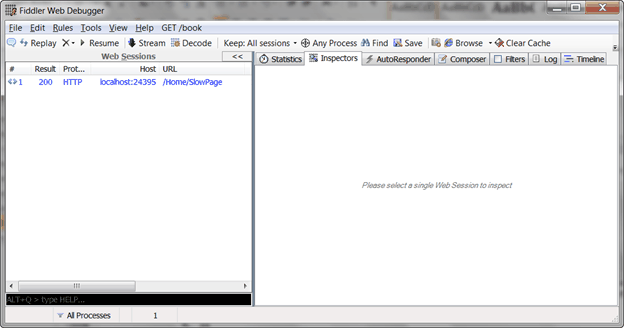
4. By selecting the captured web session item, you can see the time took to render the page.
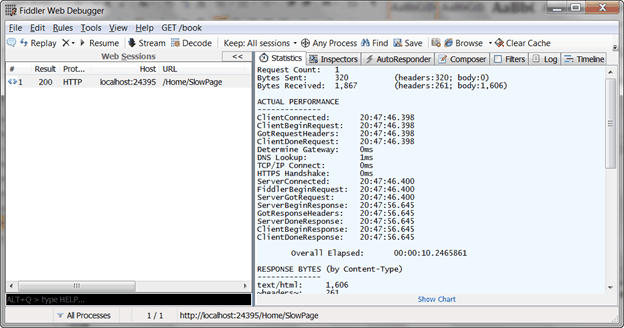
The page took more than 10 seconds to load. OK, from this, we can conclude there is a performance issue in this page.
After we determined there is a performance problem on the page, the next step is to use SQL Server profiler to profile database activities.
1. Open SQL Server Profiler.
2. Start a new trace to monitor any database activity happens on PerformanceDemo database.

3. Reload the Slow Page.
4. Go back to look at the SQL Server Profiler. Nothing is there.
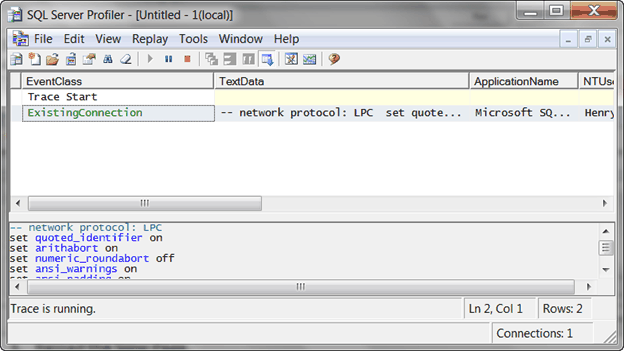
Since nothing is found in SQL Server Profiler, we can infer the performance problem is not from database side.
After database is excluded from the source of performance problem, the only possible source of performance problem we can think is application. However, the question is how to find out which line of code has performance problem. In a real life enterprise web application, a single web page could be designed to accomplish complicated business logic behind the scene. Read through all the source code is not feasible way to tell where and when is the performance problem from. So, what we really need is the runtime state of the application. DebugDiag is the tool we goanna to use to capture the runtime state of the application. You can also use WinDBG if you are more familiar with it. To me, DebugDiag is handier and simpler than WinDBG and it can just fulfill our need. However, in more advanced situation, WinDBG allows sophisticated programmer to step through source code and evaluate every single variable at runtime. Let’s start use DebugDiag to capture the runtime state of our demo application.
1. Open up DebugDiag.
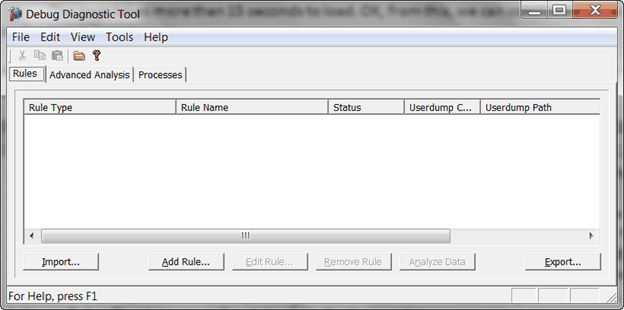
2. Add a rule for a specific process. Though DebugDiag provides a dedicated rule type to monitor long running HTTP request in IIS.
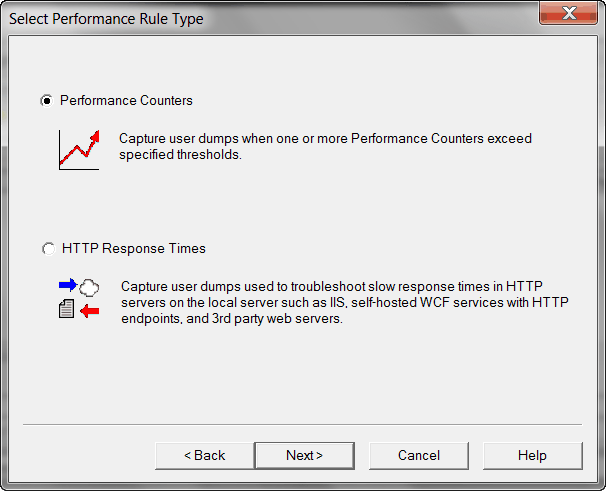
But because our application is running in Visual Studio development web server instead of IIS, so we are not going to choose that one. What we chose is to directly monitor a running process with Crash rule type.
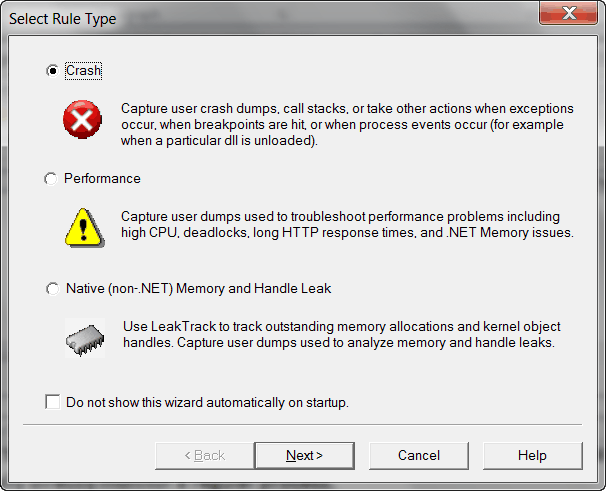
And then select target type, A specific process.

And then select the specific process, WebDev.WebServer40.EXE.
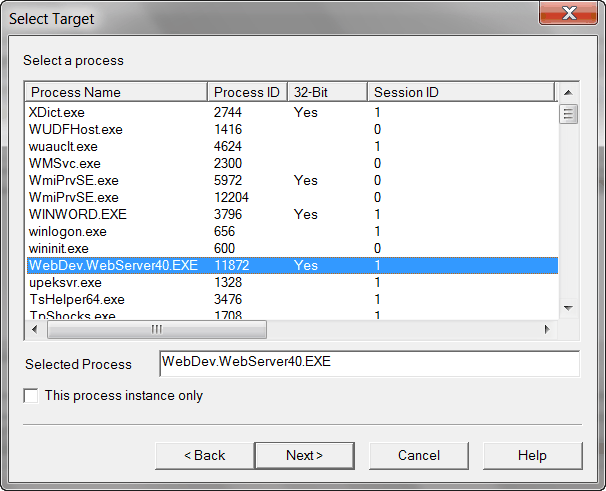
At the end, follow rest of wizard to complete the new rule with all default settings.

3. Reload the Slow Page.
4. Before the page gets complete loaded, quickly switch back to DebugDiag to manually dump a full memory dump.
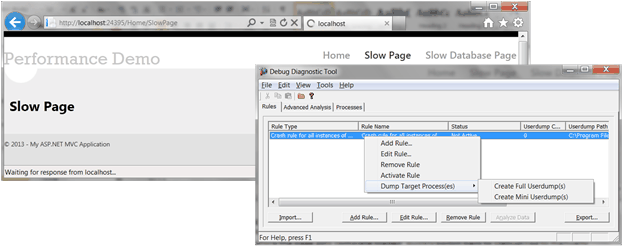
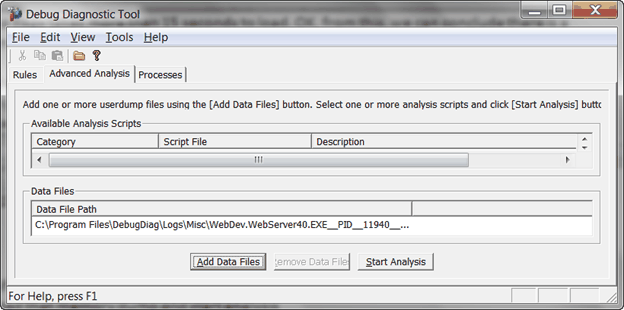
5. After the memory dumping is completed. Switch to Advanced Analysis tab of DebugDiag to load the memory dump and start analysis, and generate the memory dump report.
The report is in HTML format

By looking at the report, we can see Thread 15 is the one running in SlowPage action method and there is a Sleep method call inside of it.
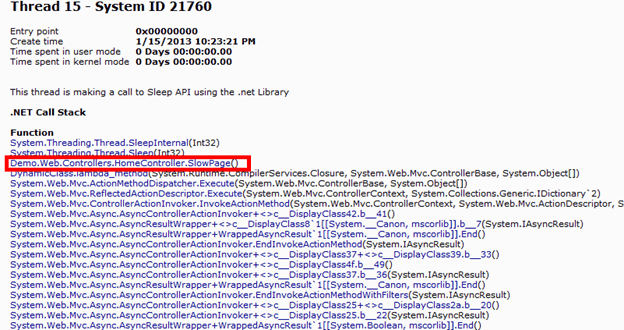
This piece of code is for demonstration purpose, so it doesn’t make any sense. In a real life scenario, we should base on the information we collected from call stack to trace back to original source code. It will most likely give us more clues on why application is running in that area.

Summary

Performance problem in ASP.NET based enterprise web application is a very common problem that most developers have faced before and will probably face in the future. Most performance problems are caused by improper design or coding in application or database. Following the process I introduced above you will be able to have a greater chance reveal the source of performance problem quickly. Let me repeat this process briefly in here.

1. Determine or confirm the performance problem with web debugging tool.
2. Profile database activities.
3. If a suspicious database activity is found, continue on to the next step, otherwise, go to step 6.
4. Copy the suspicious SQL into SQL designing tool for analysis.
5. Find the cause of performance problem in SQL and we are done.
6. Capture application memory dump.
7. Generate memory dump report and find suspicious function call in the report.
8. Go back to source code to think why the code is stuck at runtime.
9. If the source code does has inferior algorithm in place that result in time consuming operation, then we are done, otherwise, move to the next step.
10. We need help from other domain expert.

In most situations, we have performance problems from multiple places and from both application and database, so we need to repeat this process again and again until we can’t detect any significant slow web page anymore. Also, not every single performance problem is fixable or improvable. When the performance problem is improved to the point that can’t go further, then an alternative design to improve user experience should be considered. For example, providing a waiting box or progress bar to tell user the page is loading, though the visual cue can’t make page load faster, but will let user has better impression that system is not stuck in anywhere. This article only barely scratches the surface of performance problem troubleshooting for ASP.NET based enterprise web application. There are more things to be explored by software developer.

Using the Code

The code is developed in Visual Studio 2010. You need to first run the attached Database.sql to create database PerformanceDemo and table inside of it. And then, update connection string in configuration file to reference to your local database.